
Data mining is a big business. Everyone is analysing mouse clicks, mouse movements, customer purchase patterns. Such analysis has proven to give profitable insights that are driving businesses further than ever before.
But not many people have considered data mining videos. What about all that security footage that has stacked up over the years? Can we mine those for profitable insights also? Of course!
In this blog post I’m going to present a task that video analytics can do for you: the plotting of tracked customers or staff from video footage onto a 2D floor plan.
Why would you want to do this? Well, plotting on a 2D plane will allow you to more easily data mine for things such as common movement patterns or common places of congestion at particular times of the day. This is powerful information to possess. For example, if you can deduce what products customers reached for in what order you can make important decisions with respect to the layout of your shelves and placement of advertising.
Another benefit of this technique is that it is also much easier to visualise movement patterns presented on 2D plane rather than when shown on distorted CCTV footage. (In fact, in my next post I extend what I present here by showing you how to generate heatmaps from your tracking data – check it out).
However, if you have ever tried to undertake this task you may have come to the understanding that it is not as straightforward as you initially thought. A major dilemma is that your security camera images are distorted. For example, a one pixel movement at the top of your image corresponds to a much larger movement in the real world than a one pixel movement at the bottom of your image.
Where to begin? In tackling this problem, the first thing to realise is that we are dealing with two planes in the Euclidean space. One plane (the floor in your camera footage) is “stretched out”, while the other is “laid flat”. We, therefore, need a transformation function to map points from one plane to the other.
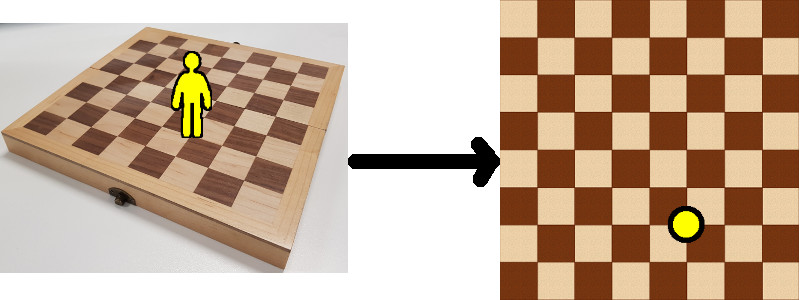
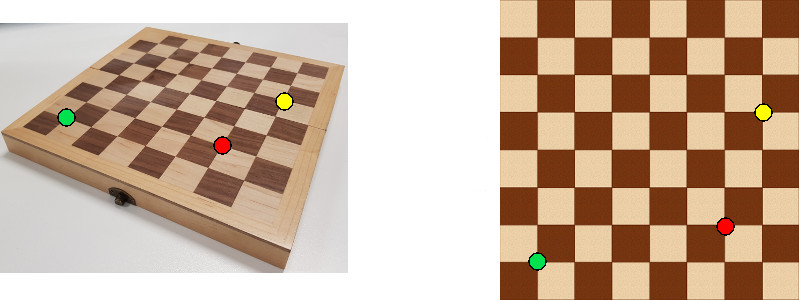
The following image shows what we are trying to achieve (assume the chessboard is the floor in your shop/business):
The next step, then, is to deduce what kind of transformation is necessary. Once we know this, we can start to look at the mathematics behind it and use this maths accordingly in our application. Here are some possible transformations:
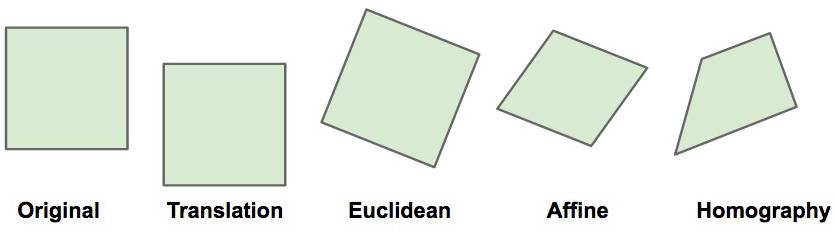
Translations (the first transformation in the image above) are shifts in the x and y plane that preserve orientation. Euclidean transformations change the orientation of the plane but preserve the distances between points – definitely not our case, as mentioned earlier. Affine transformations are a combination of translation, rotation, scale, and shear. They can change the distances between points but parallel lines remain parallel after transformation – also not our case. Lastly, we have homographic transformations that can change a square into any form of a quadrilateral. This is what we are after.
Mathematically, homographic transformations are represented as such:
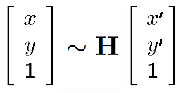
where (x,y) represent pixel coordinates in one plane, (x’, y’) represent pixel coordinates in another plane and H is the homography matrix represented as this 3×3 matrix:
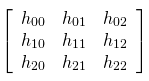
Basically, the equation states this: given a point in one plane (x’,y’), if I multiply it by the homography matrix H I will get the corresponding point (x,y) from the other plane. So, if we calculate H, we can get the coordinates of any pixel from our camera image to the flat image.
But how do you calculate this magic matrix H? To gloss over some intricate mathematics, what we need is at least 4 point pairs (4 corresponding points) from the two images to get a minimal solution (a “close enough” solution) of H. But the more point pairs we provide, the better the estimate of H will be.
Getting the corresponding point pairs from our images is easy, too. You can use an image editing application like GIMP. If you move your mouse over an image, the pixel coordinates of your mouse positions are given at the bottom of the window. Jot down the pixel coordinates from one image and the corresponding pixel coordinates in the matching image. Get at least four such points pairs and you can then get an estimate of H and use it to calculate any other corresponding point pairs.
Now you can take the tracking information from your security camera and plot the position of people on your perspective 2D floor plan. You can now analyse their walking paths, where they spent most of their time, where congestion frequently occurs, etc. Nice! But what’s even nicer is the simple code needed to do everything discussed here. The OpenCV library (the best image/video processing library around) provides all necessary methods that you’ll need:
import cv2 # import the OpenCV library

import numpy as np # import the numpy library
# provide points from image 1

pts_src = np.array([[154, 174], [702, 349], [702, 572],[1, 572], [1, 191]])

# corresponding points from image 2 (i.e. (154, 174) matches (212, 80))

pts_dst = np.array([[212, 80],[489, 80],[505, 180],[367, 235], [144,153]])
# calculate matrix H

h, status = cv2.findHomography(pts_src, pts_dst)
# provide a point you wish to map from image 1 to image 2

a = np.array([[154, 174]], dtype='float32')

a = np.array([a])
# finally, get the mapping

pointsOut = cv2.perspectiveTransform(a, h)
Piece of cake. Here is a short animation showing what you can do:
Be sure to check out my next post where I show you how to generate heatmaps from the tracking data you just obtained from your security cameras.
To be informed when new content like this is posted, subscribe to the mailing list: